


The general election in Denmark was held on 18 June 2015. The results were as follows.
Final result (source: dst.dk)
Eligible to vote: 4.145.105
Participation: 85,89 %
| Political party |
Votes |
Pct. | Seats | Kreds- man- dater |
Tillægs- man- dater |
| A. Socialdemokratiet | 924.940 | 26,3% | 47 | 43 | 4 |
| B. Radikale Venstre | 161.009 | 4,6% | 8 | 2 | 6 |
| C. Det Konservative Folkeparti | 118.003 | 3,4% | 6 | – | 6 |
| F. SF – Socialistisk Folkeparti | 147.578 | 4,2% | 7 | 2 | 5 |
| I. Liberal Alliance | 265.129 | 7,5% | 13 | 9 | 4 |
| K. Kristendemokraterne | 29.077 | 0,8% | – | – | – |
| O. Dansk Folkeparti | 741.746 | 21,1% | 37 | 33 | 4 |
| V. Venstre, Danmarks Liberale Parti | 685.188 | 19,5% | 34 | 33 | 1 |
| Ø. Enhedslisten – De Rød-Grønne | 274.463 | 7,8% | 14 | 10 | 4 |
| Å. Alternativet | 168.788 | 4,8% | 9 | 3 | 6 |
| Other | 3.066 | 0,1% | – | – | – |
| Total number of votes | 3.518.987 | ||||
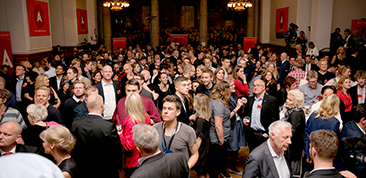
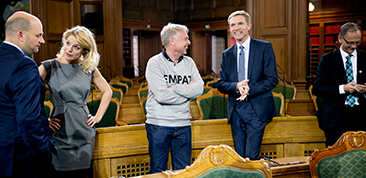
Photos from the election night at the Parliament/Christiansborg (photos by Tobias Markussen)


Originally published at https://www.thedanishparliament.dk/en/news/2015/06/2015_eng_results

